|
Introduction
The F.A.R.M. is an acronym for Friendly Animal Recognition Machine.
And it is just that.
F: It is a friendly interface for drawing and archiving images.
A: It works best with drawings of animals
R: The project's primary goal is to provide an image detector or recognizer which classifies or compares hand drawn images against a library of existing images.
M: It implements a few of the popular probability and "learning" algorithms found
in current machine learning research.
The project then is a manual training device for an image detector. It is intended to be
used for the detection and classification of hand drawn images of animals.
Correlation
The recognition work horse
of the F.A.R.M is an image processing operation known as correlation.
This is a process where one image is multiplied pixel-wise with another
image or kernel. The resulting image contains grey level intensities
which are then used as the basis for all the following operations. An
assumption can be made that after the multiplication of the images are
made, the resulting image with the highest pixel values will most likely
contain the most probable image match. Figure 1 shows an image and its
correlated output.
Correlation itself
is an expensive operation. The relative cost of the correlation
process may be circumvented by first transposing the images
to be correlated over into their spectral components. This so called
operation is based on the convolution theorem:
f*h <=> FH
The left hand side
represents the product of the convolution of the image f with that of
the kernel h. The right hand side shows the product of the Fourier transform
of the image F, and the Fourier transform of the kernel H. Now the assumption
has also been made concerning the relation between correlation and convolution.
They are intimately related operations and can be thought of as essentially
the same. The only difference being that in correlation the kernel is
rotated by 180 degrees.
Features
It is often the case that a given image may
be composed of several component parts or features. These features may be the eyes of a face,
or the legs of an animal's body. Identification of component features adds a necessary layer of
complexity to the recognition engine.
For example it allows F.A.R.M. to treat several issues related to any recognition problem.
These issues may be the rotation, scaling, or position of the desired target for which
we are searching. Feature detection then gives the ability to ask the questions:
Has part of our object been detected, and if so which parts, and how many?
Bayes/Fisher
Extraction, and identification of features is one part of the recognition task.
Another part must take into account the fact that many decisions will need to be made.
How the F.A.R.M. coordinates these multiple drawings of many varying types of
animals etc. is perhaps the most important aspect, and indeed the most challenging
to implement. Pictured below in figure 2 is a directed acyclic graph, or Baysian belief
network. It labels the nodes of the graph with some of the typical decisions the F.A.R.M.
will make. Attached to each of these nodes are probability estimates based on the
presence of the extracted features. These estimates are "online" in the sense that they
represent values which are updated each time the system runs.
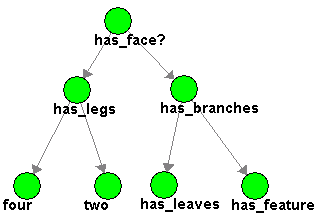 |
| Figure 2. Bayes Net of feature decision tree |
The F.A.R.M.
builds a database of drawings and classifies these drawings according relationships
or features which the detector may identify. Most of these relationships are fairly
simple. For example it may be the fact that two drawings may share a similar base shape.
This base shape could be the cartoon-like puffy shape which is shared by drawings of
clouds and sheep. The feature detecting component identifies these features and it is the
classification component which must then decide to either add the new drawing to the class
sheep, or the class cloud, or create a new class. These distinctions are kept track through
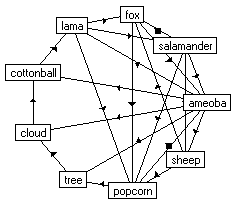
a relationships graph. The following two figures show the possible edges the engine may assemble
for these potential graphs.
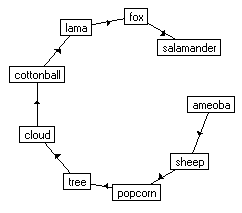 |
| Figure 3. Graph of base patterns |
 |
|
Figure 4. Graph showing more complex associations. Specifically it maps
the consistencies of shape between the amoeba, popcorn, cloud, and
cotton ball. Additionally it maps the shared relationship of the
animals all having four legs. |
The F.A.R.M. is based on and inspired by a number of existing projects:
--Pennsylvania Herpetological Atlas Amphibian and Reptile Identification Helper
--Selected Topics of Computational Vision
--JESS
--Prof. Michael Jordan
|